
11 prefectures where a state of emergency has been declared.
How is the weekend crowd changing?
I analyzed it with big data.
Tokyo metropolitan area 1 metropolitan area 3 prefectures There are also points that have increased significantly compared to 3 weeks ago
It is analyzed that the number of people at major points on Saturday 30th in the Tokyo metropolitan area increased by more than 30% in some places compared to 3 weeks before the first Saturday when the state of emergency was declared. I understand.
NHK is one of the metropolitan areas where an emergency declaration has been issued, using the location information data of mobile phones collected by the IT-related company "Agoop" with the permission of the user in a form that does not identify individuals. We analyzed the number of people at major points in the prefecture.
The analyzed time is from 6 am to 6 pm during the day and from 6 pm to midnight the next day at night.
As a result, it was found that the number of people on Saturday 30th was higher in some places than on 9th of this month, which was the first Saturday of the state of emergency, three weeks ago.
Looking at the daytime,
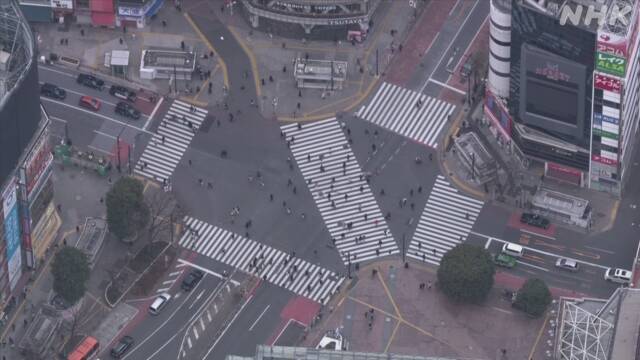
▽ increased by 33% near Shibuya Scramble intersection
,
▽ increased by
8% near Omiya station, and
▽ increased by 6% near Tokyo station.
On the other hand, it decreased by 39% near Chiba Station and
decreased by 9% near Yokohama Station.
Looking at the nighttime,
▽ increased by 39% near Shibuya Scramble intersection
,
▽ increased by
20% near Omiya station
,
▽
increased by
5% near Tokyo station, and
▽ increased by 3% near Yokohama station.
On the other hand, it decreased by 53% near Chiba Station.
Furthermore, there are conspicuous points that were more than doubled compared to the time of the first state of emergency issued last year.
During the daytime, the
area around Omiya station increased by 211% from the average of holidays when the first declaration was issued, which was about 3.1 times higher.
▽ Shibuya Scramble crossing area increased by 198%, about 3 times,
▽ Yokohama station area increased by 185%, about 2.9 times,
▽ Tokyo station area increased by 165%, about 2.7 times.
▽ The number of people near Chiba Station increased by 34%.
At night,
▽ Shibuya Scramble crossing area increased by 296%, about 4 times,
▽ Yokohama station area increased by 282%, about 3.8 times,
▽ Omiya station area increased by 214%, about 3.1 times, and
▽ Tokyo station area. Increased by 134%, about 2.3 times.
▽ The number of people near Chiba Station increased by 36%.
“Expansion of declaration” 7 prefectures There are also points where the number has increased significantly compared to 2 weeks ago
The number of people in the three prefectures of Osaka, Hyogo, and Kyoto in the Kansai region and the four prefectures of Tochigi, Aichi, Gifu, and Fukuoka on Saturday 30th is also higher than it was two weeks ago, which was the first Saturday after the declaration of an emergency. It was increasing depending on the.
First, looking at the daytime at the main points,
▽ In the vicinity of Gifu Station, there was an increase of 46% compared to the 16th of this month, two weeks before the first Saturday when the state of emergency was declared.
▽
Increased by
29% near Nagoya Station,
▽ 23% near Sannomiya Station in Kobe City,
▽ 12% near Osaka Umeda Station,
▽ 6% near Kyoto Station.
On the other hand,
▽ near Utsunomiya station decreased by 36%,
▽ near Hakata station decreased by 10%.
Looking at the nighttime,
▽ Gifu station area increased by 53%,
▽ Nagoya station area
increased by
37%,
▽ Kobe city Sannomiya station area increased by 27%,
▽ Osaka Umeda station area increased by 18%, respectively. Did.
On the other hand,
▽ near Utsunomiya station decreased by 44%,
▽ near Hakata station decreased by 11%, and
▽ near Kyoto station decreased by 3%.
Furthermore, it is 2 to 6 times higher than when the first state of emergency was declared.
During the daytime,
▽ around Osaka Umeda station increased by 551%, which was about 6.5 times the average of holidays when the first declaration was issued, and
▽ near Hakata station, increased by 439%, about 5.4. Double,
▽ Kobe city Sannomiya station area increased by 349%, about 4.5 times,
▽ Nagoya station area increased by 309%, Kyoto station area increased by 305%, about 4.1 times,
▽ Gifu station area increased by 201%, about 3
times
Double,
▽ The area around Utsunomiya station increased by 105%, about 2.1 times.
Even at night,
▽ Osaka Umeda station area increased by 574%, about 6.7 times,
▽ Hakata station area increased by 453%, about 5.5 times,
▽ Kobe city Sannomiya station area increased by 407%, about 5.1 times. ,
▽ Nagoya station area increased by 334%, about 4.3 times,
▽ Kyoto station area increased by 312%, about 4.1 times,
▽ Utsunomiya station area increased by 234%, about 3.3 times,
▽ Gifu station area increased by 186%. It was 2.9 times.
Third weekend after "declaration" In Umeda, Osaka
It is the third Sunday, 31 days after the state of emergency was declared in the three prefectures of Kansai.
In Umeda, Osaka, people were seen going out while taking measures against infection.
It is the third Sunday since the state of emergency was declared in the three prefectures of Osaka, Hyogo and Kyoto.
Around Umeda, Osaka, the blue sky spread from the morning, and people in masks were seen coming and going.
A boy in the third year of high school said, "I came to Osaka by train for college entrance exams. I felt that there were many people in the car. I want to be careful not to get caught in the corona." ..
A man in his 50s living in Osaka said, "I was absent from work due to a state of emergency, so I went out to donate blood."
A woman in her thirties with children aged 0 and 2 said, "I went for a walk in the morning when there were few people because I live nearby. There are fewer people than usual, but I wonder if it has decreased so much. I hesitate to go shopping in my living area. "