- Direct: news of the coronavirus in Spain, last minute
- Graphics: Coronavirus map: expansion in numbers of Covid-19 in the world
- Graphs: Map of the coronavirus in Spain: evolution of cases by Autonomous Community
EXCESS MORTALITY IN SPAIN
The Ministry of Health shows in a report the mortality from all causes in Spain. In the graph that we show below, we collect the death period between December 1, 2019 and April 20, 2020. It shows a period of excess mortality in Spain between March 17 and April 20 , coinciding with the blackest days of deaths from Coronavirus.
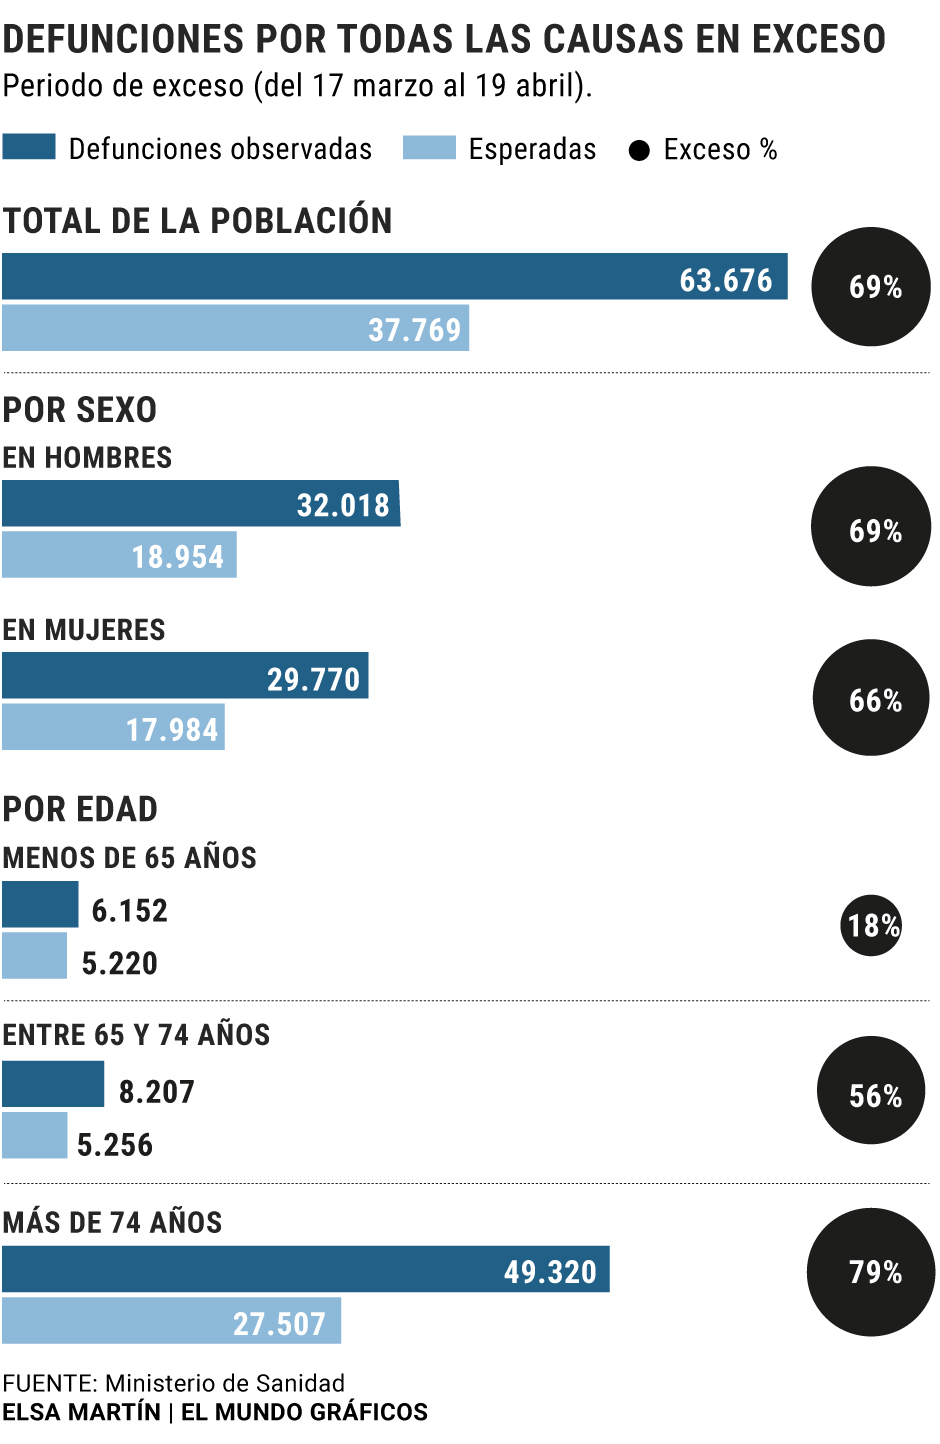
EXCESS MORTALITY PERIOD
Below we break down the deaths that occurred in Spain between March 17 and April 19. In this analysis we can see that the% of excess mortality is higher in men than in women and that there is also a 79% excess between the estimated deaths and those observed in people over 74 years of age.
MADRID, ONE OF THE COMMUNITIES WITH THE MOST EXCESS MORTALITY
The Ministry of Health also breaks down all-cause mortality by community. Madrid is the community that shows one of the greatest excesses of mortality between March 9 and April 9.
NUMBER OF TESTS TAKEN IN SPAIN
While the WHO does not stop emphasizing the importance of doing more and more tests to control the disease, Spain still does not give a figure unlike countries such as Italy or Germany, which have subjected the population to more than a million tests to know the radiography of the epidemic in their regions. From the Ministry they only point to around 20,000 newspapers, as the only data.
According to the criteria of The Trust Project
Know more- Science and health
- Covid 19
- Graphics
- Spain
- Respiratory diseases
- Diseases
- Coronavirus
- Health

