
An analysis of the number of people on the three consecutive holidays up to the 11th in each of the three prefectures in Tokyo, where the second state of emergency was declared, showed that all of them decreased from last month's Saturdays, Sundays, and holidays, but last year's first declaration. Big data analysis showed that it was well over time.
NHK uses mobile phone location information data collected by IT-related company "Agoop" with the permission of users in a form that does not identify individuals, and uses data around major stations in 1 metropolitan area and 3 prefectures and in downtown areas. We analyzed the number of people during the three consecutive holidays.
The analyzed time is
▽ from 6:00 am to 6:00 pm during the daytime around the station ▽ from 6:00 pm
to midnight the next day in the downtown area.
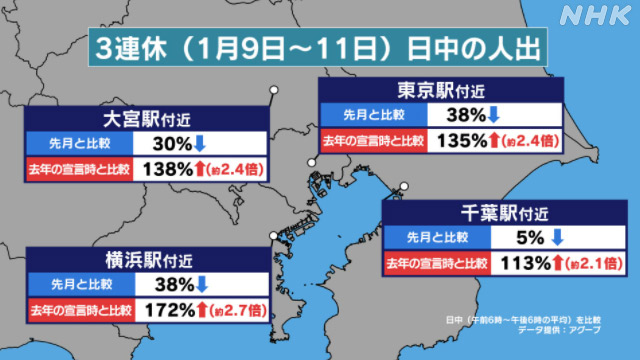
People around the main station
As a result, the number of people around major stations decreased by 5% to 40% from the average of Saturdays, Sundays, and holidays last month, but compared to the average of Saturdays, Sundays, and holidays when the state of emergency was declared last year. It has more than doubled.
Of this, Tokyo Station decreased by 38% compared to last month, but increased by 135%, which is about 2.4 times that of last year's declaration.
In addition, Yokohama station decreased by 38% compared to last month, increased by 172%, which is about 2.7 times compared to last year's declaration, and Omiya station decreased by 30% compared to last month, about 2.4 compared to last year's declaration. It increased by 138%, which is double, and decreased by 5% from last month, and increased by 113%, which is about 2.1 times from the time of the declaration last year.
People in the downtown area
In addition, the downtown area has the same tendency, and although it decreased by 30% to 50% from the average of Saturdays, Sundays, and holidays last month, it has quadrupled in many places compared to the average of Saturdays, Sundays, and holidays at the time of last year's declaration. It was increasing.
Of this, Ginza decreased by 38% compared to last month, but increased by 299%, which is about four times as much as when it was declared last year.
In addition, Shinjuku / Kabukicho decreased by 42% compared to last month, increased by 152%, which is about 2.5 times that of last year's declaration, and Shibuya Scramble crossing decreased by 46% compared to last month's declaration. Roppongi increased by 212%, which is about 3.1 times, decreased by 34% compared to last month, and increased by 68% compared to the time of the declaration last year.
After the Golden Week holidays, the number of people at Tokyo Station is almost the same as last month.
The number of people at Tokyo Station on the morning of the 12th has not changed significantly since the first day of the declaration of emergency, the 8th of this month, and is about the same level as last weekday, about 20% higher than the time of the first declaration last year. It turned out from the analysis of big data.
NHK used big data collected by NTT DoCoMo from mobile phone base stations in a privacy-protected manner to analyze the number of people around Tokyo Station at 8 am on the 12th.
As a result, there was no significant change from the morning of the 8th of this month, which was the first day of the state of emergency, and there was no significant change, which was almost the same level as the average of 2% on weekdays last month. I will.
On the other hand, it is about 20% higher than the average on weekdays when the last state of emergency was declared from April to May last year.