
No “holiday forecast”
This summer overview is intended to provide an overall assessment and average picture of the coming summer, where summer is defined as the period June to August (calendar summer).
Scenario 1 is the main scenario and scenario 2 is a secondary scenario.
It is important to remember that this is not a "holiday forecast".
The maps only show an overall, static overall picture, while the weather in reality is very dynamic and varies.
However, the average value picture shows whether a certain type of weather and its consequences become more dominant than others.
Large-scale expected mean pressure image and expected mean position of the polar jet stream according to scenario 1. Photo: SVT
Scenario 1
The large-scale flow pattern over Europe and the surrounding area appears to be characterized by generally low-pressure weather over the North Atlantic, especially over Iceland and eastern Greenland, but sometimes also across Scandinavia.
At the same time, the Azores high pressure is also expected to extend over Western Europe, and in the long run, high pressure will also be formed in rounds over eastern and north-eastern Europe.
Typically, the polar jet stream often takes a relatively northern path.
The weather pattern in the image may be broken relatively often, but is still expected to be dominant enough to make an impression.
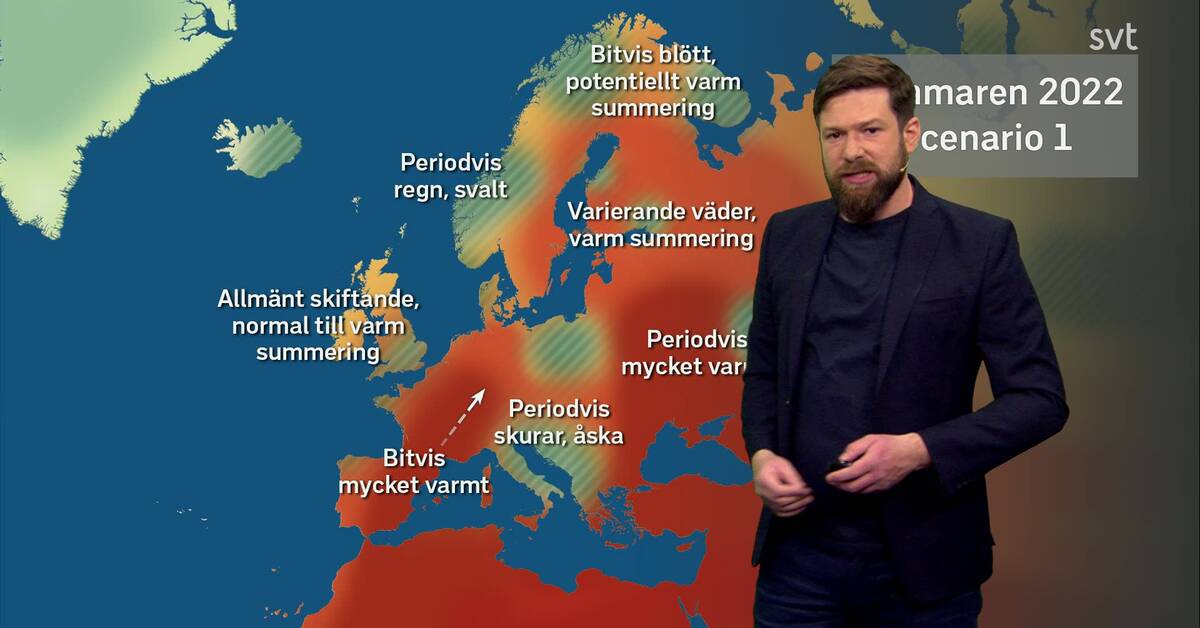
Impact assessment for scenario 1. Green to red fields show a combination of expected air mass distribution and expected deviations from normal value, but without special classification.
Green lined fields show areas with more rain than normal.
The text in the map is to give a more dynamic description and facilitate the interpretation of the map.
Photo: SVT
Scandinavia and Finland
It looks like it could be a relatively hot summer in a large part of Scandinavia and Finland, but you can probably count on the weather changing a bit over time as it usually does.
Northern Sweden and northern Finland have the potential to get a warm summary if scenario 1 strikes, but more low pressure is expected here in general and therefore it can get wetter at times right there.
Western and southern Norway, in this scenario, appear to receive some rain in periods, which in itself is not unusual.
However, the summed way can end up being pretty cool.
Southern Sweden, as well as southern and central Finland, will probably receive relatively normal amounts of rain, but there is a risk that it will be considerably drier than normal due to unpredictable details in the weather development.
Denmark feels a bit insecure, but a normal or somewhat hot summer is probably the most likely outcome there.
More extreme,
Heat waves
It is likely that at least on a number of occasions it will be possible to experience really hot air over Scandinavia and Finland, which may become more extensive with some risk of extreme heat.
Especially in eastern Sweden and Finland.
It is not at all impossible that the high pressure that brings with it the heat may have a more westerly extent as a result of extra reinforcement.
In that case, it can also cause high temperatures in several places in Norway.
The heat cycles are not expected to be very long, a couple of days to a week at most at a time, provided that we do not just get a reinforced high pressure.
However, this is not the most likely scenario.
Risk of forest fires
Should heat waves recur with greater density than expected, the risk of forest fires increases markedly, especially since it also becomes predominantly dry as a result.
At present, however, the varying weather is expected to reduce any risk of forest fires that occur at regular intervals.
The southern third of Sweden, as well as southern and central Finland, are the areas that should be kept an extra eye on.
Groundwater (applies to Sweden)
After a largely dry or very dry spring, the groundwater levels in the small reservoirs at the time of writing are below or well below normal in several places in Sweden.
When it comes to large reservoirs, it is mainly southern Svealand, northeastern Götaland and Gotland that are below or much below.
Only a really wet summer has the potential to stabilize the small magazines, a normal wet or dry summer will leave existing deficits unchanged or worsened.
Feel free to read more about groundwater here (external link).
Western Europe and the British Isles
Overall, high-pressure high pressure in several rounds.
Occasionally it can get very hot in Spain, Portugal and France.
In the long run, very hot air can move up towards Germany and the Benelux.
Over France-Benelux-Germany the heat will probably vary and will probably be replaced by some thunderstorms.
Depending on the details of the weather development, it is also likely that the British Isles will get the heat from time to time, but at the same time it will also be quite cool and rainy in batches due to more low-pressure weather.
Eastern Europe and Western Russia
Eastern Europe also gets rounds with very hot weather, western Russia included.
A bit further east over Russia, however, it looks more normal or even cooler than normal.
This hot air is expected to be humid and can bring some thunderstorms.
Central Europe, the Balkans and Italy
Central Europe, as well as the Balkans and Italy also seem to have predominantly warm weather and even here it can get very hot at times.
However, this area appears to have a slightly higher probability of rain and thunder, at least more than normal, which affects the average image of the weather in the area as a whole.
However, Greece appears to be experiencing predominantly dry weather.
Extreme weather events with a lot of rain are in principle impossible to predict under these conditions, but can of course occur.
Scenario 2
This is an alternative scenario that is there to highlight uncertainties in the overview that are more concrete.
Scenario 2 should preferably not be the opposite of scenario 1 and it is not in this case.
Large-scale expected mean pressure image and expected mean position of the polar jet stream according to scenario 2. Photo: SVT
In this scenario, we have a more active low-pressure path over northern Scandinavia, while southern Scandinavia, the British Isles and Central Europe become more high-pressure.
In southern Europe unusually unstable and low-pressure instead.
Impact assessment for scenario 2. Green to red fields show a combination of expected air mass distribution and expected deviations from normal value, but without special classification.
Green lined fields show areas with more rain than normal.
The text in the map is to give a more dynamic description and facilitate the interpretation of the map.
Photo: SVT
Differences compared to scenario 1
The biggest differences if the summer were to assume a development similar to scenario 2 are limited to certain areas.
Northern Scandinavia, for example, would have a much cooler summer, but not necessarily wetter.
Around the Mediterranean, there will be more rain and thunder over a fairly widespread area and also cooler than normal.
At the same time, there will not be such big differences across southern Sweden except that it increases the probability of a mostly dry summer.
In southern and southwestern Norway, the difference becomes clearer, as do the British Isles and probably also Denmark, which has significantly more stable and drier weather than scenario 1 shows, probably also warmer.
How was this summer overview produced?
Producing a summer overview can be done in a few different ways, but it is best to include as many different angles as possible to give as good an overall assessment as possible.
There are a number of institutes around the world that publish computer-calculated seasonal forecasts.
Several of these are gathered in the international collaboration Copernicus and can be viewed here (external link).
I am also looking for so-called analog years.
These are years that have several similar conditions in the large-scale weather on the global scale and that would like to have had similar weather development as the current year in the near future.
The latter is not always quite as important, but it can be.
Analogous years are good for studying the behavior of the atmosphere in those years and connecting any connections to each other.
If something similar can be applied to the current year and find several common mentions with one or more analogues, then it is a very good support.
In addition, scientific reports are used that describe various connections, an important tool.
It can be a connection between sea and atmosphere or tropical rainy weather and the large-scale weather at our latitudes.
Just to name a few examples.
Analogous years
Summer 2001
Spring shows relatively large similarities with the current year globally and applies to a number of different phenomena and connections.
The summer that followed offered shifts similar to scenario 1 in Scandinavia, with a couple of heat waves of different lengths spread over the summer from the end of June to fairly late August.
However, with some cooler and rainier periods in between.
The summer of 2001 has been used as a mainstay in the development of scenario 1.
Summer 1975
The summer is predominantly hot and dry in southern Scandinavia, cool and partly wet in the north.
Just as in 2001, there was some variation in the weather.
The most distinctive feature is the extreme heat wave in the first half of August, especially in the southern half of Scandinavia.
Several heat records were broken that still stand today.
The summer of 1975 is interesting because the autumn and winter that followed (1975-76) were marked by a La Niña for the third year in a row.
There are trends that point to the same phenomenon this year.
The same applies to the summer of 2000, but it has proven to be a less good analogue for other reasons.
The summer of 1975 has been the basis for scenario 2.
The summers of 2003 and 2012
Not the best analogues but both are interesting to watch.
That this year's summer would go in a straight through cool and wet track like the summer of 2012 does not feel so likely right now.
The summer of 2003 was more high-pressure over the British Isles than the summer of 2001, but otherwise there are some similarities between the two.
However, 2003 was generally warmer, especially in Central and Southern Europe where it was at times very extreme.
The method not scientifically tested
The method I use is not scientifically tested, but is based, as previously mentioned, on research that is available.
Many other meteorological institutes use similar methods.