
China News Service, August 4th. Chao Qingchen, deputy director of the National Climate Center, introduced the "China Blue Book of Climate Change (2021)" on the 4th, and pointed out that comprehensive observations of the climate system and a number of key indicators indicate that the climate system is still warming. Continued, the risk of extreme weather and climate events further intensified.
The China Meteorological Administration held a press conference on the 4th.
At the meeting, Chao Qingchen introduced the core conclusions of the "China Blue Book on Climate Change (2021)" from five aspects of the climate system (atmosphere, hydrosphere, cryosphere, biosphere) and climate change drivers.
Chao Qingchen pointed out that comprehensive observations of the climate system and a number of key indicators indicate that the warming of the climate system is still continuing, and the risk of extreme weather and climate events has further increased.
Data map: In high-temperature weather, citizens travel with "covered clothes".
Photo by China News Agency reporter Yu Jing
In terms of the atmosphere, Chao Qingchen said that the global warming trend is still continuing.
In 2020, the global average temperature is 1.2°C higher than the pre-industrial level (average value from 1850 to 1900), which is one of the three warmest years since complete meteorological observation records.
The average temperature of the Asian land surface is 1.06℃ higher than the normal annual value (this report uses the climate base period from 1981 to 2010), which is the warmest year since the beginning of the 20th century.
China is a sensitive area and a significant impact area of global climate change, and the rate of temperature increase is significantly higher than the global average during the same period.
From 1951 to 2020, the annual average temperature of China's surface showed a significant upward trend, with a heating rate of 0.26℃/10 years.
The past 20 years have been the warmest period in China since the beginning of the 20th century. Among the 10 warmest years since 1901, except for 1998, the remaining 9 years all appeared in the 21st century.
Chao Qingchen said that China's average annual precipitation is increasing, and there are obvious differences in precipitation changes between regions.
From 1961 to 2020, the average annual precipitation in China showed an increasing trend, with an average increase of 5.1 millimeters every 10 years; from 1961 to 2020, precipitation in the eastern part of the Yangtze River, central and northern Qinghai-Tibet Plateau, northern and western Xinjiang increased significantly.
Extreme events such as high temperature and heavy rainfall have increased and the level of climate risk in China tends to rise.
From 1961 to 2020, China's extreme heavy precipitation events showed an increasing trend, and extreme low temperature events decreased. Extreme high temperature events have increased significantly since the mid-1990s; the average intensity fluctuations of typhoons that landed in China have increased since the late 1990s.
From 1991 to 2020, the average value of China's climate risk index (6.8) increased by 58% from the average value of 1961 to 1990 (4.3).
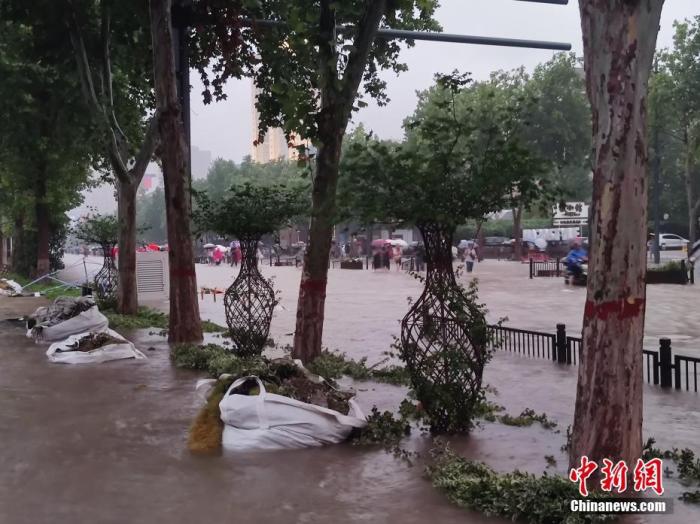
Data map: Heavy rainfall caused water to accumulate in the streets.
Photo by Kan Li, China News Agency reporter
Regarding the hydrosphere, Chao Qingchen pointed out that ocean warming is accelerating, and the global average sea level is accelerating.
Ocean warming accelerated significantly after the 1990s.
From 1990 to 2020, the rate of increase in global ocean heat content is 5.6 times the rate of warming from 1958 to 1989.
The average global sea level rise rate has increased from 1.4 mm/year from 1901 to 1990 to 3.3 mm/year from 1993 to 2020.
The sea level change along the coast of China shows a fluctuating and rising trend as a whole.
From 1980 to 2020, the sea level rise rate along the coast of China was 3.4 mm/year, which was higher than the global average during the same period.
2020 is the third highest since 1980.
The amount of surface water resources in China has changed significantly from year to year, and the water level of Qinghai Lake has continued to rise.
In the 1990s, it was mainly too much, and from 2003 to 2013 was generally less. Since 2015, the amount of surface water resources has turned mainly too much.
Since 2005, the water level of Qinghai Lake has rebounded for 16 consecutive years, and in 2020 it has reached the water level in the early 1960s.
In terms of the cryosphere, Chao Qingchen said that the global mountain glaciers are in a state of retreat and retreat. Since 1985, the melting has accelerated.
The glacier No. 1 at the headwaters of the Urumqi River in the Tianshan Mountains, the Mus Island Glacier in the Altai Mountains, and the Xiaodong Kemadi Glacier in the source area of the Yangtze River all show an accelerated melting trend.
In 2020, the ends of the east and west branches of Glacier No. 1 at the headwaters of the Urumqi River retreated 7.8 meters and 6.7 meters, respectively.
The permafrost on the Qinghai-Tibet Plateau is degraded significantly.
From 1981 to 2020, the thickness of the active layer in the permafrost areas along the Qinghai-Tibet Highway showed a significant increase, with an average thickness of 19.4 cm every 10 years; from 2004 to 2020, the temperature at the bottom of the active layer showed a significant upward trend, and the permafrost was degraded significantly .
According to reports, since the beginning of this century, the average snow coverage of the snow-covered areas in northwestern China, northeast and central-north China has shown a weak downward trend; the average snow cover of snow-covered areas on the Qinghai-Tibet Plateau has increased slightly, with interannual oscillations. obvious.
In 2020, the average snow coverage rate in the northwestern snow area will be the lowest in the past five years.
The extent of Arctic sea ice is decreasing.
From 1979 to 2020, the Arctic sea ice extent showed a consistent downward trend; in September 2020, the Arctic sea ice extent was the second lowest value in the same period since satellite observation records.
From 1979 to 2015, the Antarctic sea ice range fluctuated and increased; but since 2016, the South China Sea ice range has generally been relatively small.
In terms of the biosphere, Chao Qingchen pointed out that China's vegetation coverage has increased steadily, showing a green trend.
From 2000 to 2020, China's annual average normalized vegetation index (NDVI) showed a significant upward trend. From 2016 to 2020, it increased by 6.0% from the average of 2000-2019, marking the best five years of vegetation coverage since 2000. .
The spring phenology of representative plants in different regions of China showed an earlier trend.
From 1963 to 2020, the start of the leaf development period of Magnolia at Beijing Station, Robinia pseudoacacia at Shenyang Station, Weeping Willow at Hefei Station, Liquidambar formosana at Guilin Station, and Acer saccharum at Xi’an Station will advance by 3.4 days, 1.4 days, 2.3 days, 2.8 days and 2.8 days respectively every 10 years. 2.7 days.
Data map: Villages, fields, and forests form a beautiful landscape.
Photo by Zhu Xingyong
Chao Qingchen said that the ecological climate in key areas is steadily improving.
From 2005 to 2020, the desert area of the Shiyang River Basin in the northwestern region has shown a decreasing trend; the extension speed of the desert edge has generally slowed down.
From 2000 to 2020, the autumn vegetation index in the rocky desertification area of Guangxi showed a significant increasing trend, and the regional ecological conditions tended to improve.
Over the past 30 years, the coverage of live reef corals in China's seas has shown a downward trend. Since the 1970s, the area of mangroves in China has first decreased and then increased.
Since 2010, the phenomenon of thermal bleaching of corals in the South China Sea has continued to appear, and the impact of climate warming on the coral reefs of the South China Sea has gradually become prominent.
In 2020, affected by the continued high sea temperature in summer, severe coral thermal bleaching events occurred in the Nansha Islands and Paracel Islands.
Regarding the driving factors of climate change, Chao Qingchen said that the average concentration of major greenhouse gases in the world has reached a new high, and the carbon dioxide concentration of the global atmospheric background station at Wariguan, Qinghai, China has been increasing year by year.
In 2020, the concentration of the main greenhouse gases carbon dioxide, methane and nitrous oxide will continue to rise.
In 2019, the annual average concentrations of CO2, CH4, and N2O at Wariguan Station were roughly the same as the average concentrations in the mid-latitudes of the northern hemisphere, and both were slightly higher than the global average in 2019.
In addition, Chao Qingchen said that the overall aerosol optical thickness of the regional atmospheric background station has shown a downward trend.
From 2004 to 2014, the annual average fluctuations of the aerosol optical thickness of the atmospheric background stations in Shangdianzi, Zhejiang, Lin'an, and Longfengshan, Heilongjiang increased; from 2015 to 2020, they all showed a significant decreasing trend.