
- Waste, Ispra study: serious situation, the sea is a huge landfill, 77% is plastic
- Rome waste, doctors: alarm but not medical emergency
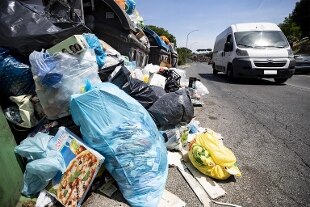
- Chaos refuses to Rome, another Cda from Ama resigns
Share
20 November 2019190 euros in Trentino Alto Adige, 421 in Campania. Italy is thus divided on the waste tax. To draw the accounts of 2019, on a national average of 300 euros, is the Cittadinanzattiva Prices and Tariffs ObservatoryHowever, the survey assessed the most expensive provincial capital as Catania with 504 euros and an increase of 15.9% compared to 2018, while Potenza is the cheapest, 121 euros with a decrease of 13.7%
Prices in the provincial capitals
Analyzing the rates of the 112 provincial capitals examined, increasing variations were found in about half, 51 cities; rates stable in 27 capitals and decreasing in 34. In Matera the highest increase (+ 19.1%), in Trapani the most significant decrease (-16.8%).
Prices at regional level
At the regional level, waste costs less in the North (on average 258 euros), followed by the Center (299 euros), and finally the South, more expensive (351 euros). In Abruzzo, for example, the average is 326 euros per family (+ 1.8% compared to 2018), but it goes from 373 euros in L'Aquila to 283 euros in Pescara, while in Chieti there is an increase of 13, 4% compared to 2018.
Separate collection
As for how far we are with separate waste collection, it ranges from 61.4% in Teramo to 35.7% in L'Aquila. 68% of Italian families believe they are paying too much for waste collection: a consideration that is stronger in Sicily with 83.4%, follows Umbria with 80.2%, Puglia with 79 , 1%, Campania with 78.4%.
These unknown waste in the Service Charter
Finally, the survey highlights how difficult it is to find data on how waste is managed in municipalities or companies on the service charter. Latita 60% of municipal administrations and companies. Only 2 out of 3 indicate the type of collection carried out, half of it indicates the frequency with which it is carried out. And if it is difficult for a consumer association to find the data, it is more difficult for the citizen. It is not easy to know, for example, how often bins are sanitized (only 47% of the cards indicate this), roads are cleaned (37%) or bins are emptied on the street (25%).