
Share
11 June 2019 Istat data show that, in 2018, households resident in Italy spent an average of 2,571 euros per month in current values and substantially it seems that there has been no change compared to 2017. In reality, considering the inflationary dynamics, that is the 'increase in prices (which was 1.2%), spending decreased by 0.9% in real terms. It therefore contracted for the first time after the positive dynamics recorded from 2014 to 2017. Spending is still far from the levels of 2011 (2,640 euros per month), which were followed by two years of strong reduction, but the average value does not hold up. account of all the components that characterize income, geographical residence and the specific features of the assets. Therefore Istat went into detail.
The North-South divide
The highest and above the national average spending levels are recorded in the North-West (2,866 euros), the North-East (2,783) and the Center (2,723 euros); lower, and lower than the national average, in the South (2,087 euros) and the Islands (2,068 euros). Also in 2018 the well-known territorial gaps are observed, the origins of which are to be found in various factors of an economic and social nature (incomes, consumer prices, spending habits and behavior). In the North-West an average of 800 euros more are spent in absolute terms than in the Islands, i.e. 38.6% more in relative terms, but the gap falls below 40% for the first time since 2009 (in 2017 was 45%).
To weigh more on household expenses in the South and in the Islands, where economic resources are generally lower, the items destined to satisfy basic needs, for example those for food: compared to the national average (18.0%), the share for food expenditure is 22.9% in the South and 21.3% in the Islands, while in the North-East it stops at 16.0%. The regions with the highest average monthly expenditure are Lombardy (3,020 euros), Valle d'Aosta (3,018 euros) and Trentino-Alto Adige (2,945 euros); in particular, in Trentino-Alto Adige there are, compared to the rest of the country, the highest shares of expenditure for hospitality and catering services (6.2% against 5.1% of the national average) and for recreational goods and services , entertainment and culture (6.1% against 5.0%), continues Istat.
Calabria is confirmed as the region with the lowest expenditure, equal to 1,902 euros (1,118 euros less than Lombardy), followed by Sicily (2,036 euros per month). In Calabria, the share of expenditure on food and non-alcoholic beverages reaches 23.4%, the highest incidence after that recorded in Campania (23.8%).
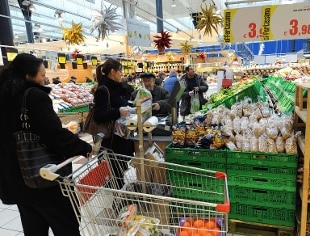
What families spend on
The composition of expenditure remains substantially unchanged compared to 2017: it is still the home that absorbs the most significant share (35.1% of total expenditure), followed by expenditure on food and non-alcoholic beverages (18.0%) and for Transport (11.4%). Families spent an average of 462 euros per month on food and non-alcoholic beverages. More specifically, expenditure increases were recorded for meat (+ 4.0%), fish and fish products (+ 3.4%) and for coffee, tea and cocoa (+ 5.0%). Meat is also the most important item of food expenditure in terms of the composition of the cart, accounting for 3.8% of total expenditure. Only the expenditure for sugar, jams, honey, chocolate and confectionery decreased significantly (-2.6%). Spending on non-food goods and services is € 2,110 per month,this too stable compared to 2017 (€ 2,107). For housing, water, electricity and other fuels, ordinary and extraordinary maintenance, expenditure remains unchanged (with the exception of the Northeast, where it falls by 3.5%) and equal to 35.1% of the total. The largest share after the home is destined for transport (11.4%). This is followed in order by personal care, personal effects, social assistance services, insurance and financial services, hospitality and catering services and recreational goods and services, entertainment and culture, health and health services, clothing, furniture, articles and services for the home. . Only the expenditure for communications (equal to 2.4% of total expenditure) has decreased considerably compared to 2017 with a -2.5%.ordinary and extraordinary maintenance, expenditure remains unchanged (with the exception of the North-East, where it contracted by 3.5%) and equal to 35.1% of the total. The largest share after the home is destined for transport (11.4%). This is followed in order by personal care, personal effects, social assistance services, insurance and financial services, hospitality and catering services and recreational goods and services, entertainment and culture, health and health services, clothing, furniture, articles and services for the home. . Only the expenditure for communications (equal to 2.4% of total expenditure) has decreased considerably compared to 2017 with a -2.5%.ordinary and extraordinary maintenance, expenditure remains unchanged (with the exception of the North-East, where it contracted by 3.5%) and equal to 35.1% of the total. The largest share after the home is destined for transport (11.4%). This is followed in order by personal care, personal effects, social assistance services, insurance and financial services, hospitality and catering services and recreational goods and services, entertainment and culture, health and health services, clothing, furniture, articles and services for the home. . Only the expenditure for communications (equal to 2.4% of total expenditure) has decreased considerably compared to 2017 with a -2.5%.housing is used for transport (11.4%). This is followed in order by personal care, personal effects, social assistance services, insurance and financial services, hospitality and catering services and recreational goods and services, entertainment and culture, health and health services, clothing, furniture, articles and services for the home. . Only the expenditure for communications (equal to 2.4% of total expenditure) has decreased considerably compared to 2017 with a -2.5%.housing is used for transport (11.4%). This is followed in order by personal care, personal effects, social assistance services, insurance and financial services, hospitality and catering services and recreational goods and services, entertainment and culture, health and health services, clothing, furniture, articles and services for the home. . Only the expenditure for communications (equal to 2.4% of total expenditure) has decreased considerably compared to 2017 with a -2.5%.4% of total expenditure) has decreased significantly compared to 2017 with a -2.5%.4% of total expenditure) has decreased significantly compared to 2017 with a -2.5%.
What families cut
Italian families continue to cut on travel and holidays. In fact, the Istat report on "Household consumption expenses 2018" shows that 39.3% of families that already incurred travel and holiday expenses tried to reduce them, with a maximum of 53.9% in the South. The real cost savings fall on clothing and footwear. Istat reports that almost half (48.9%) of the families who already bought these goods a year before the interview have in fact changed their habits, trying to limit their spending. Also in this case the Institute notes strong territorial differences: one tries to save more in the South (62.7%) than in the Center (47.6%) and above all in the North (40.3%).
The expense for medical examinations and periodic examinations, largely "incompressible", is the one on which Italian families "act less" to try to limit expenses. In fact, only 16.1% of families declare that they have spent less, moreover with strong North-South disparities: 10.1% in the North, 17.9% in the Center and 24.1% in the South. On the other hand, 6.1% of families declare that they have increased their healthcare spending.
Compared to a year before the interview, however, two thirds of families have not changed their habits in terms of food spending, either up or down.
Families of foreigners
Spending capacities and consumption habits vary according to the citizenship of the components. In 2018, the gap between the expenditure of households made up of only Italians (2,627 euros) and that of households with at least one foreigner (1,984 euros) is 644 euros (24.5% less), a gap that rises to 927 euros. (-35.3%) if we consider families of only foreigners.
Food expenditure absorbs 21.3% of the total among families with foreigners (422 euros per month), 17.7%, among those of Italians only (466 euros) and 21.9% (372 euros) if in the family they are all foreigners.
For housing, water, electricity and other fuels and for clothing and footwear, the spending shares of families with at least one foreigner are in line with those of Italian-only families. If, on the other hand, families of only foreigners are considered, the relative weight of the home rises to 36.6% (621 euros per month), and that of clothing and footwear to 5.2% of the total (89 euros).
The share of spending on communications continues to be higher among households with at least one foreigner (3.1%, equal to 61 euros), in particular among those of only foreigners (3.3%, 56 euros) compared to families of Italians only (2.4%, 62 euros per month); this happens mainly because foreigners need to keep in touch with the family network and friendships in their countries of origin.