
HUGO GARRIDO
@hgrosado
Madrid
PAUL MEDINA
Sunday, 10 November 2019 - 20:28
- Share on Facebook
- Share on Twitter
- Send by email
- Live. General elections 2019, live
- Abstention. Participation in the general elections falls four points compared to April
- Vote. Results of the 2019 elections: scrutiny and seats
- Anecdotes. Elections 2019: Rufián's photo with a Vox controller
Closed the schools and known polls conducted in recent days, with interviews until this day, the PSOE would win the elections again but with a slight decline in the intention to vote with respect to the generals in April. While Vox and the PP would benefit from electoral repetition, Citizens would be the most punished force compared to 28-A.
The governance scenarios left by the surveys are complicated compared to those of six months ago. Now the possibility of a government between the PSOE and the oranges disappears, and the only viable coalition in numerical terms would be that of the left-wing forces (PSOE, UP and More Country) along with ERC and PNV (and would still need some additional support ) or an agreement between socialists and popular (either in the form of a large coalition or with the abstention of one of them to govern the other).
EL MUNDO offers you the possibility of simulating government coalitions based on data from various surveys that estimate the allocation of seats.
The evolution of the estimations of voting in the key of ideological blocks also undergoes changes: in the face of the tie in intention of voting of 28-A, now the right-wing block could add more seats than the set of PSOE, United We Can and More Country.
[If you have trouble viewing the chart, click here]
The Spanish Constitution sets the province as a constituency when distributing deputies in a general election. Consequently, the number of seats of a candidacy will vary depending on how their votes are concentrated throughout the national territory, and hence the ranks (also known as hairpins) that sometimes attribute the polls when estimating deputies.
[If you have trouble viewing the chart, click here]
* UP Includes the voting estimates of Podemos and Izquierda Unida until the formation of Unidos Podemos, in April 2016. ** More Country includes the estimates of Compromís vote, a formation that the 10-N will concur in coalition with More Country.
Which candidate can form a government? The numbers vary according to the polling company, but no applicant approaches a forecast that allows him to reach the Moncloa Palace with the sole support of his deputies. The 28-A already left five large parliamentary groups and the scenarios drawn by the polls go through government coalitions or agreements that allow adding the necessary votes in the investiture session: 176 seats in the first vote or simple majority in the second .
What do the surveys tell us?
Drop down
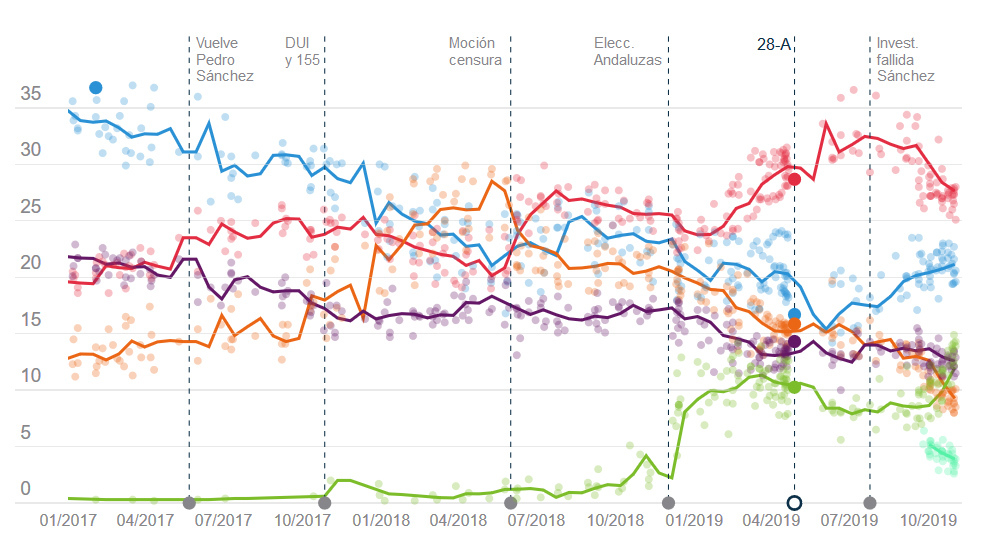
The EL MUNDO DATA survey aggregator collects data from 539 works carried out by 19 survey companies since January 2015 . The average number of surveys is estimated based on the model proposed by the former director of research and analysis of Sigma Dos, José Miguel Elías . Three types of trend line are offered: biweekly, weekly and daily. The difference is found in the number of days elapsed for its calculation. The points that draw each of the lines are the photo of the climate of political opinion at a given moment.
The increase in the electoral offer experienced since 2015 causes a growing indecision among the voters, which increasingly delay the meaning of their vote. Consequently, the call to the polls means that the demographic data known until then must be interpreted with more caution.
Given the certainty of a real call for elections, once you know the date, it is when undecided voters (up to 33-35% of the population in previous calls) begin to opt for one acronym or another and decide if they abstain or they go to their electoral college
Is it possible that the vote estimate changes so much in such a short time? Some variations are explained by the choice of respondents and the margin of error of each survey, depending among other factors on the number of respondents (sample size). However, the main difference is found in the statistical model that each polling company follows when calculating the vote estimate of each party, the so-called "kitchen".
By averaging different opinion studies, the effect of the different models is reduced to show a more accurate image, with less statistical noise, of who the Spaniards would vote in a hypothetical electoral advance.
Methodology: this is how this information is done
Drop down
The EL MUNDO survey aggregator obtains the vote estimate data in the averages from the date of the field work of each survey (period in which the interviews are conducted). To calculate the average over time, a weighted moving average system is used, which includes the surveys of the last 28 days and the sample size (number of respondents).
Given a date, a survey loses value week by week over the previous 28 days. Surveys gain weight with different weighting factors according to the sample size and are discarded if they do not reach a minimum threshold.
All averages are calculated on the same model, with the difference that the points that draw the trend line are calculated with different time intervals. The biweekly average is built on points calculated every 15 days; the weekly, every 7; and the diary for each day between January 12, 2015 (date of the first survey) and the date of completion of the field work of the last survey included in the aggregator. Thus, the average biweekly variation is less sensitive to statistical noise, but it takes longer to detect trend changes. The daily average picks up changes in the vote faster although it is more sensitive to the margins of error and the "cooking effect".
In the case of the CIS (Center for Sociological Research) surveys with information on voting intention, since September 2018 a different estimate is applied to the one officially published by the public body. Given the various changes in methodology in recent months and the absence of an official estimate since December, EL MUNDO has applied the method used between January 2017 and July 2018, as reported by the CIS itself in response to a request for access to public information in this newspaper.
For the pact simulator, national surveys published as of October that offer distribution of seats for nationally established parties and regional forces are included. In the event that an interval (hairpin) is offered in the prognosis of deputies, the average value of each hairpin has been calculated when assigning an estimate of seats to a party.
According to the criteria of The Trust Project
Know more- More Country
- PSOE
- PP
- Vox
- United We Can
- Citizens
- CIS
- We can
- Pedro Sanchez
- Pablo Casado
- IU
- Spain
- ERC
- Commitment
- CIS Survey
- Data journalism
General Elections in Spain Polls of intention to vote for the November general elections in Spain
General elections 2019 This is the electoral polls for the November general elections in Spain
General Elections in Spain Polls of intention to vote for the November general elections in Spain