
How has the movement of people across prefectures changed during the Golden Week holidays, where there are no restrictions on behavior for the first time in three years?
Analysis of big data for the 10 days up to the 8th revealed that it increased by 30% from last year's Golden Week holidays and returned to 82% of the time before the spread of the new coronavirus.
NHK used data collected by NTT DoCoMo from mobile phone base stations in a privacy-protected manner to analyze the number of people who traveled across prefectures during this long holiday.
(15 to 79 years old. Compared by percentage based on the average number of people in the 3:00 pm range)
As a result, the national average of people who moved across prefectures was declared as an emergency in 4 prefectures such as Tokyo and Osaka. This is a 34% increase from last year's long holidays.
And it turned out that it returned to 82% compared to the Golden Week holidays in 2019, three years before the spread of the new coronavirus infection.
From Tokyo?
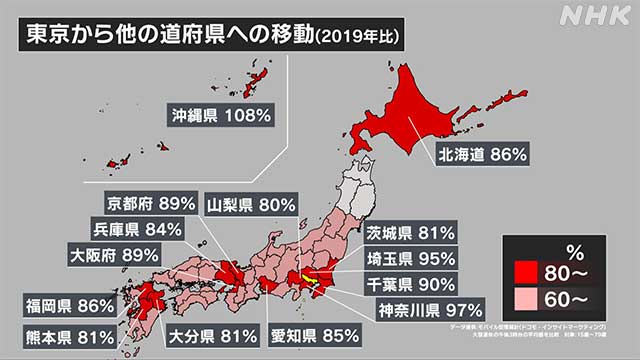
Travel from Tokyo to other prefectures increased by 24% from last year, returning to 85% three years ago.
Looking at the comparison with 3 years ago by prefecture of destination,
▽ Okinawa prefecture was 108%, which was higher than before the spread of infection.
This was followed by
▽ Kanagawa prefecture 97%
▽ Saitama prefecture 95%
▽ Chiba prefecture 90%
▽ Osaka prefecture and Kyoto prefecture 89% each
▽ Hokkaido and Fukuoka prefecture 86% respectively
.
In addition to prefectures with a lot of traffic such as various parts of the metropolitan area, areas with a lot of tourists such as Okinawa, Kyoto, and Hokkaido occupy the top ranks.
From Osaka?
Movement from Osaka Prefecture increased by 48% from last year, returning to 83% three years ago.
Looking at the comparison with 3 years ago by prefecture of destination,
▽ Okinawa prefecture was 104%, which was higher than before the spread of infection, like from Tokyo.
This was followed by
▽ Kyoto prefecture at 94%
▽ Tokyo at 93%
▽ Hyogo prefecture at 92%
▽ Ibaraki prefecture at 91%
▽ Shiga prefecture and Nara prefecture at 90%
.
What prefecture is "people back"?
Then, where was the prefecture where more "people came back"?
Comparing the number of people visiting from other areas with those before the spread of the infection,
▽ Tokyo was 95%
▽ Kanagawa and Saitama prefectures were 92% respectively, and
it was these three prefectures that exceeded 90%. ..
Next,
▽ Kyoto prefecture 89%
▽ Okinawa prefecture 88%
▽ Osaka prefecture 87%
▽ Aichi prefecture and Chiba prefecture 86% respectively
▽ Nara prefecture and Shiga prefecture 85%
▽ Hyogo prefecture and Ibaraki prefecture respectively
, 84% respectively
.
The national average was 82%, and it was these 12 prefectures that exceeded the average.
On the other hand, looking at the order of the lowest percentage of visitors compared to before the spread of infection,
▽ Aomori prefecture and Akita prefecture each 59%
▽ Iwate prefecture 63%
▽ Kagoshima prefecture 64%
▽ Nagasaki prefecture 65%
▽ Miyazaki Prefecture was 66%
.
The number of people on long holidays, which increased significantly from last year and returned to more than 80% before the spread of the infection, is centered on metropolitan areas and popular tourist destinations, and there are differences depending on the region.