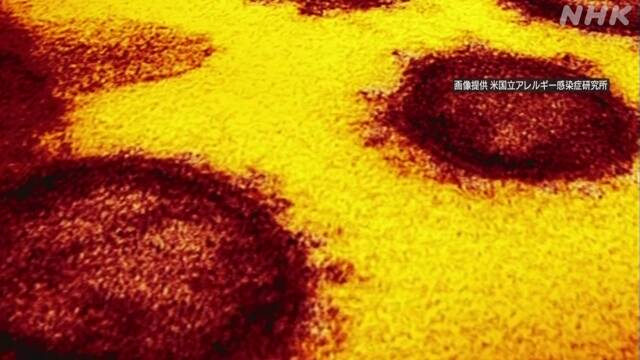
The government's "Coronavirus Infectious Disease Control Subcommittee" has put together a new idea that measures should be taken with a greater emphasis on the degree of medical strain.
The subcommittee says that the level of medical care will be decided by each prefecture because the degree of medical care will be different in each prefecture.
In response to this, the Cabinet Secretariat decided to show two indicators for determining the level of prefectures: "load on medical care provision system" and "infection status".
Of these, the "load on the medical care provision system, etc." includes
"use rate of secured beds,"
"usage rate of severely secured beds,"
"hospitalization rate," and "
compared to last week." There are 5 items.
In addition, "infection status" includes
"positive rate of PCR test" ,
"number of new positives" per 100,000 people, "number of
new positives", "compared to last week", "compared to last week", and "
persons whose infection route is unknown". There are five items, "Ratio of".
As of the 5th of this month, the Cabinet Secretariat released data for nine prefectures: Hokkaido, Chiba, Tokyo, Aichi, Osaka, Hiroshima, Yamaguchi, Fukuoka, and Okinawa.
Load of medical care provision system, etc.
"Usage rate of secured beds" is:
・ 4% in Hokkaido,
・ 5% in Chiba prefecture, ・ 5% in
Tokyo, ・ 5% in
Aichi prefecture,
・ 9% in Osaka prefecture,
・ 18% in Hiroshima prefecture,
・ 23% in Yamaguchi prefecture,
・ 3% in Fukuoka prefecture, ・
23% in Okinawa prefecture.
"Usage rate of severely ill beds" is:
・ 0% in Hokkaido,
・ 1% in Chiba prefecture,
・ 5% in Tokyo, ・
0% in Aichi prefecture,
・ 1% in Osaka prefecture,
・ 4% in Hiroshima prefecture ,
・ 0% in Yamaguchi prefecture,
・ 1% in Fukuoka prefecture,
・ 32% in Okinawa prefecture.
The "hospitalization rate" and its "compared to last week" are:
・ Okinawa prefecture is 12%, 0.66 times.
All other eight prefectures are not applicable.
See the end of the sentence for "not applicable".
This is the "change in the number of severely ill people" compared to last week.
If the value continues to exceed 1, it indicates an increasing trend.
・ It was 1.17 times in Tokyo,
1.00 times in Osaka prefecture
, 1.11 times in Fukuoka prefecture,
and 2.06 times in Okinawa prefecture.
There is no data in the other 5 prefectures.
Infection status
最近1週間のPCR検査などの陽性率です。
・北海道で1.8%、
・千葉県で0.8%、
・東京都で2.5%、
・愛知県で0.2%、
・大阪府で3.8%、
・広島県で0.2%、
・山口県で1.2%、
・福岡県で0.7%、
・沖縄県で9.3%でした。
人口10万当たりの最近1週間の新規陽性者数です。
・北海道で3人、
・千葉県で3人、
・東京都で7人、
・愛知県で3人、
・大阪府で8人、
・広島県で14人、
・山口県で22人、
・福岡県で2人、
・沖縄県で80人でした。
次に、新規陽性者数の「先週比」です。
数値が1を超える状態が続くと増加傾向にあることを示します。
・北海道で1.17倍、
・千葉県で3.96倍、
・東京都で3.02倍、
・愛知県で3.78倍、
・大阪府で3.01倍、
・広島県で24.69倍、
・山口県で11.11倍、
・福岡県で1.54倍、
・沖縄県で6.95倍でした。
「先々週比」は、
・北海道で1.64倍、
・千葉県で3.80倍、
・ 4.75 times in Tokyo,
・ 6.23 times in Aichi prefecture,
・ 6.40 times in Osaka prefecture,
・ 197.50 times in Hiroshima prefecture,
・ 60.00 times in Yamaguchi prefecture,
・ 2.94 times in Fukuoka prefecture,
・ 33.57 times in Okinawa prefecture. ..
Finally, the percentage of people whose infection route is unknown.
・ 30% in Hokkaido,
・ 59% in Chiba prefecture,
・ 68% in Tokyo,
・ 47% in Aichi prefecture,
・ 53% in Osaka prefecture,
・ 40% in Hiroshima prefecture,
・ 23% in Yamaguchi prefecture,
・ Fukuoka It was 64% in the
prefecture and 66% in Okinawa prefecture.
Not applicable
The government's "New Coronavirus Infectious Disease Control Subcommittee" states that the "hospitalization rate" index does not apply in the following cases.
▽ When the number of medical treatment is less than 10 per 100,000 population.
▽ The number of new positives who need to be hospitalized can be hospitalized by the day after the notification of the outbreak.

