
The government subcommittee has four stages that indicate the infection status, and as indicators for determining which stage it is in, "bed tightness", "number of medical treatments", "positive rate of PCR test", "new infection" "Number of people", "Comparison of the number of infected people in the last week and the previous week", and "Percentage of people whose infection route is unknown" are listed.
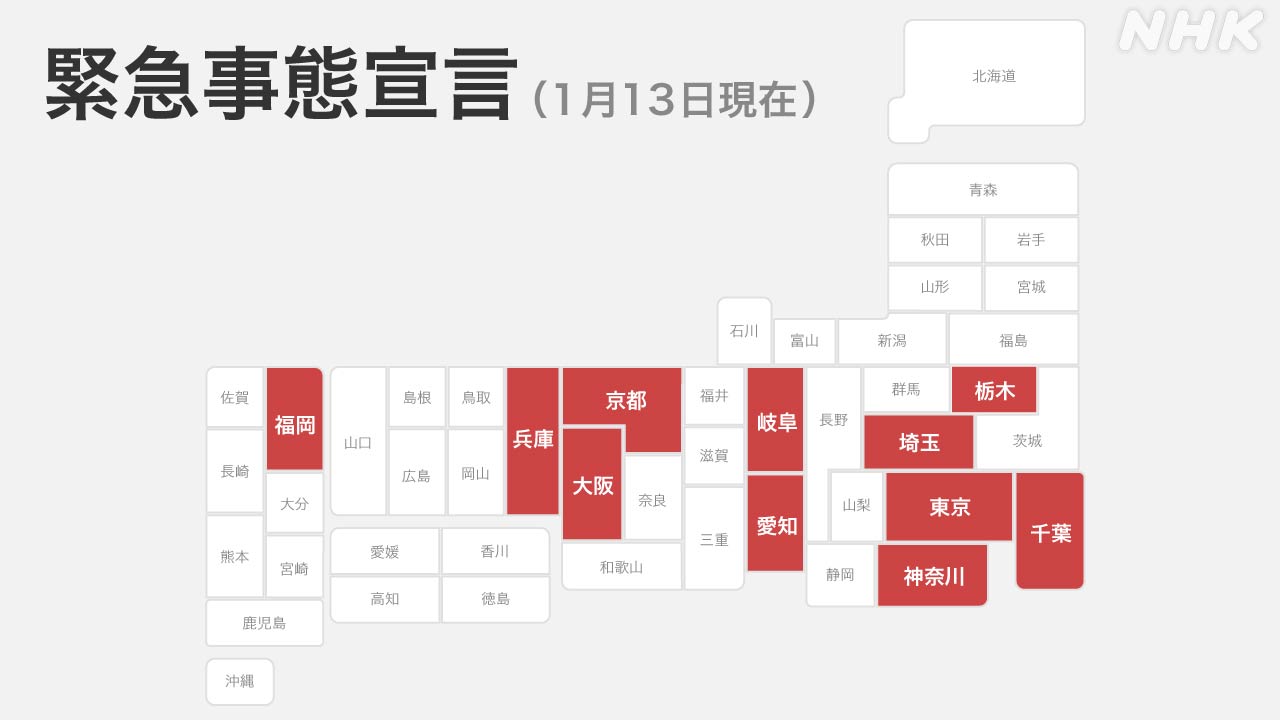
According to the Cabinet Secretariat, as of the 14th of this month, the 11 prefectures that declared a state of emergency have exceeded the most serious "Stage 4" guideline in a number of indicators.
[1 Tightness of the bed]
First of all, the tightness of the bed.
As a guide, the bed usage rate is 20% for stage 3 and 50% for stage 4.
The usage rate of the entire bed is
▽ 78.3% in Tokyo
▽
61.8% in Saitama
▽
51.9% in Chiba
▽
44.0% in Kanagawa
▽
61.5% in Tochigi
▽
63.7% in Aichi
▽
63.7% in
Gifu
▽ Osaka 67.8% in
prefecture ▽ 78.3% in Hyogo prefecture ▽
37.1% in Kyoto prefecture
▽ 57.4% in Fukuoka prefecture.
Of these, the beds for the severely ill are
▽ 104.6% in Tokyo
▽
37.0% in Saitama
▽
22.2% in Chiba
▽
51.0% in Kanagawa
▽
41.3% in Tochigi
▽
47.1% in Aichi
▽ 35.3% in Gifu
▽ 68.3% in Osaka prefecture ▽
59.2% in Hyogo prefecture
▽
31.4% in Kyoto prefecture ▽
18.2% in Fukuoka prefecture.
[2 Number of recuperators]
Next, the number of recuperators is about 100,000 people, 15 in stage 3 and 25 in stage 4.
▽ 139.7 people in Tokyo
▽
73.0 people in Saitama prefecture ▽
76.6 people in Chiba prefecture ▽
66.8 people in Kanagawa prefecture
▽
66.8 people in
Tochigi prefecture
▽
44.8 people in Aichi prefecture
▽
35.1 people in Gifu prefecture
▽
71.0 people in Osaka prefecture
▽ Hyogo 31.4 people in the
prefecture ▽
56.7 people in Kyoto prefecture ▽
62.5 people in Fukuoka prefecture.
[3 test positive rate]
This is the positive rate for PCR tests in the last week.
The standard value is 10% for both stage 3 and stage 4.
▽ Tokyo Metropolitan area 13.3%
▽ Saitama prefecture 7.5%
▽ Chiba prefecture 13.5%
▽ Kanagawa prefecture 19.8%
▽ Tochigi prefecture 11.3%
▽ Aichi prefecture 8.0%
▽ Gifu prefecture 7.7%
▽ Osaka prefecture 9.0%
▽ Hyogo
prefecture
Prefecture is 12.5%
▽ Kyoto prefecture is 10.3%
▽ Fukuoka prefecture is 11.9%.
[4 Number of newly infected people]
The standard number of newly infected people per 100,000 population is 15 in stage 3 and 25 in stage 4.
▽ Tokyo 81.0 people
▽ Saitama prefecture 39.2 people
▽ Chiba prefecture 47.7 people
▽ Kanagawa prefecture 64.3 people
▽ Tochigi prefecture 36.8 people
▽ Aichi prefecture 27.4 people
▽ Gifu prefecture 25.3 people
▽ Osaka prefecture 43.3 people
▽ Hyogo
prefecture
The prefecture has 32.6 people
▽ Kyoto prefecture has 36.6 people
▽ Fukuoka prefecture has 38.9 people.
[5 Comparison of the number of newly infected persons in the last week and the previous week]
When comparing the number of infected people in the last week and the previous week, the standard value is 1 times for both stage 3 and stage 4.
▽ Tokyo 1.3 times
▽ Saitama prefecture 1.4 times
▽ Chiba prefecture 1.6 times
▽ Kanagawa prefecture 1.7 times
▽ Tochigi prefecture 1.0 times
▽ Aichi prefecture 1.2 times
▽ Gifu prefecture 1.0 times
▽ Osaka prefecture 1.5 times
▽ Hyogo The prefecture is 1.5 times,
Kyoto prefecture is 1.3
times, and Fukuoka prefecture is 1.4 times.
[6 Percentage of people with unknown infection route]
Finally, the percentage of people whose infection route is unknown.
The standard value is 50% for both stage 3 and stage 4.
▽ 61.5% in Tokyo
▽
44.2% in Saitama
▽
83.0% in Chiba
▽
56.2% in Kanagawa
▽
46.1% in Tochigi
▽
51.1% in Aichi
▽
39.6% in Gifu
▽
56.4% in Osaka
▽ Hyogo It was 53.3% in the
prefecture ▽
41.4% in Kyoto prefecture ▽
56.0% in Fukuoka prefecture.