
Regarding the 1 metropolitan area and 3 prefectures subject to the state of emergency, the government subcommittee pointed out on the night of the 5th that measures equivalent to the most serious "stage 4" of the four stages indicating the infection status are required. did.
On top of that,
during the period of the declaration, the infection status was lowered to the equivalent of "Stage 3" as soon as possible
, and even if the declaration was canceled, it was not at the stage where the infection was rapidly increasing. Until then, the necessary measures should be continued.
Then, what is the current situation of 1 metropolitan area and 3 prefectures?
Let's look at each of the six specific items.
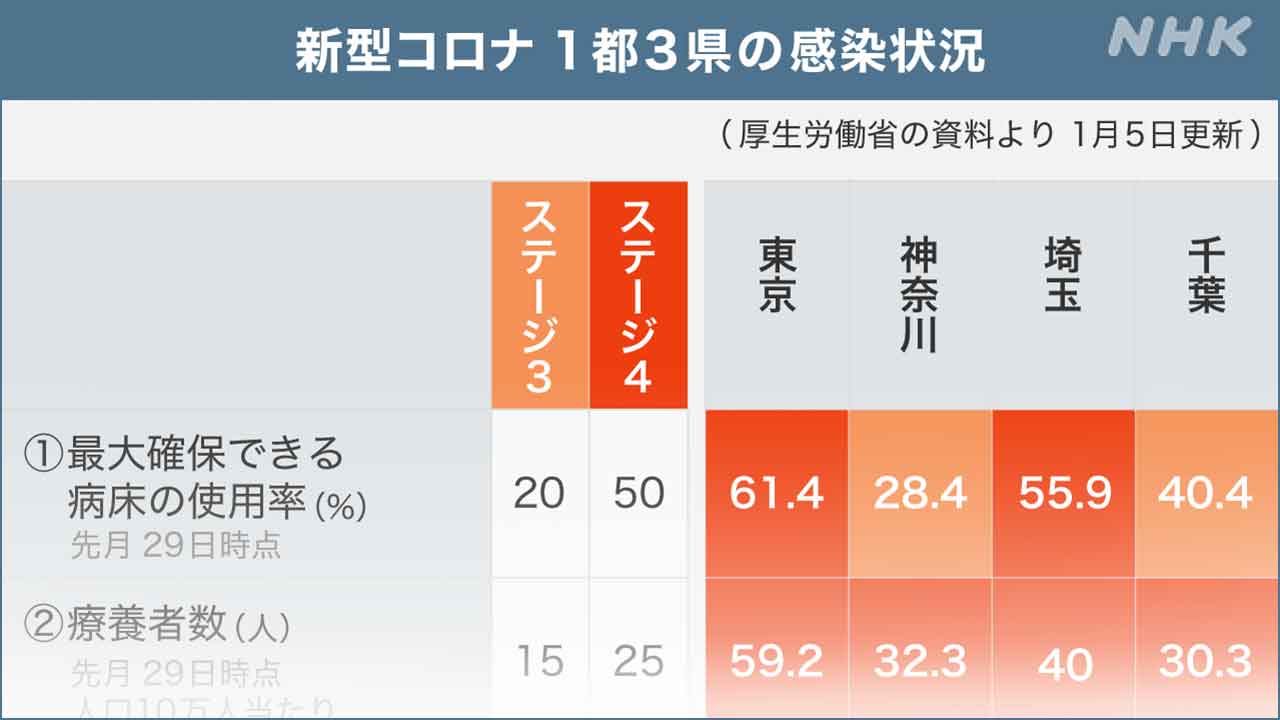
1 The tightness of the bed
First of all, the tightness of the bed.
According to the Ministry of Health, Labor and Welfare, the maximum bed usage rate that can be secured as of the 29th of last month
was 61.4% in Tokyo
and 55.9% in Saitama prefecture,
both exceeding the stage 4 index of "50%". I did.
In Tokyo, the usage rate is 75.8%, which is higher than the stage 4 index of 50%, even for the maximum number of beds secured for critically ill patients.
On the other hand, Kanagawa and Chiba prefectures exceed the stage 3 index.
2 Number of recuperators
Next is the number of recuperators.
As of the 29th of last month, per 100,000 population,
▽ 59.2 in Tokyo
,
▽
40 in Saitama
,
▽
32.3 in Kanagawa
▽ 30.3 in Chiba
, stage 4 indicators in all three prefectures. It is said that there are more than 25 people.
3 PCR positive rate
The positive rate of the PCR test did not exceed 10%, which is the index of stage 3 and stage 4, in the week until 27th last month, but
▽ 9.5% in Kanagawa prefecture,
▽ 7.2% in Chiba prefecture,
▽ It
is gradually increasing to
6.8% in Tokyo
and 6.5% in Saitama prefecture.
4 Number of new positives
Furthermore, the number of new positives.
The number of newly infected people per 100,000 population in the week up to the 4th of this month is
46.22 in Tokyo
and 33.09 in Kanagawa
, which exceeds the 25 people who are the index of stage 4.
▽ Saitama prefecture has 23.89 people,
▽ Chiba prefecture has 23.77 people,
which exceeds the 15 people who are the index
of
stage 3.
5 Comparison of the number of newly infected people in the last week and the previous week
A comparison of newly infected people in the last week and the previous week shows that in all three prefectures in one city, the number of newly infected people in the week up to the 4th of this month exceeded the previous week, showing the indicators for stages 3 and 4. It is over.
6 Percentage of people with unknown infection route
Finally, the percentage of people whose infection route is unknown.
On average for the week up to the 25th of last month, the percentage of people whose infection route is unknown is
61.7% in Tokyo,
56.7% in Kanagawa,
and 52.2% in Chiba, which
are indicators of stages 3 and 4. It exceeded 50%.
▽ Saitama Prefecture was 39.4%.