
3 consecutive holidays in August Move across prefectures Decline to nearly half of last year August 13 19:31
k10012565701_202008131913_202008131914.mp4
With the spread of the new coronavirus spread and the movement to refrain from going home and traveling spread, big data revealed how much people are actually refraining from. Using the data of NTT Docomo, NHK analyzed the number of people who moved across prefectures during the three consecutive holidays until October 10th, and as a result, it decreased to almost half, 55% of the same period last year. I understand.
Based on data collected by NTT Docomo from mobile phone base stations in a form that protects privacy, NHK calculated the number of people who moved across prefectures for three consecutive holidays until August 10 (August 8-10). (Sunday) and 3 consecutive holidays (August 10th to 12th) of the same period last year and compared and analyzed.
*Comparison in percentage based on the average number of people from noon to 4:00 pm.
As a result, the number of people who moved between prefectures during the three consecutive holidays until the 10th of this month was decreasing in all prefectures, and it decreased to almost half, 55% of the same period last year, nationwide.
Estimated by the number of people, it means that about 12.2 million has been reduced to 6.7 million.
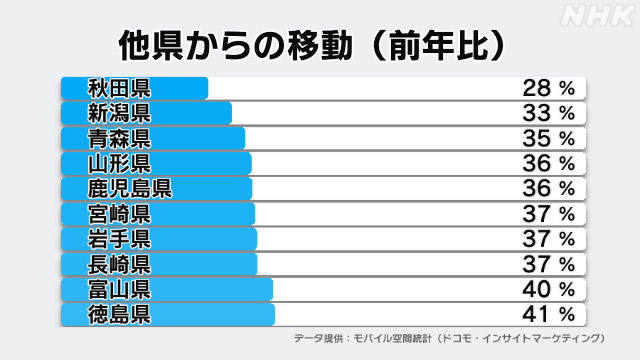
In addition, the number of people who came from other prefectures was the
lowest in Akita prefecture at 28% during the same period last year,
▽ 33% in Niigata prefecture,
35% in Aomori
prefecture, and 36 in Yamagata prefecture and Kagoshima prefecture. %
▽ In Miyagi, Iwate, and Nagasaki prefectures, which decreased to 37%
, 29 prefectures in Japan had decreased to less than 50%.
On the other hand, the decrease is small around large cities such as Tokyo and Osaka:
▽ 74% in Saitama and Nara last year ▽
71% in Kanagawa ▽
67% in Kyoto
▽ 66% in Chiba Has become.
It can be seen from big data that while the movement of people is decreasing nationwide, the impact is small in metropolitan areas such as Tokyo and Osaka, while the impact is extremely large in remote prefectures.
Kuniaki Sasaki, a professor at Waseda University who is familiar with the analysis of people's movements, said that the data corroborated that they were actually refraining from returning home and traveling to the rural areas because of the new coronavirus. Since it is expected that it will continue, it is necessary to take measures according to the region, such as how to restore the local economy including tourism and how to recover the local economy, attracting people to the local and neighboring prefectures, etc. I point out.
Which prefecture do you want to move to?
From big data that shows the movement of people across prefectures, you can also analyze which prefecture moved from a specific prefecture.
Who are the people in Tokyo?
How did the movement of people in Tokyo change from the same period last year during the three consecutive holidays until the 10th of this month?
First of all, the number of people in Tokyo has increased by 11% since last year, and it is estimated that the number is estimated to be nearly one million.
The movement from Tokyo to other prefectures decreased in all,
▽ Akita prefecture decreased the most at 14% of the same period last year,
▽ Iwate prefecture 16%
▽ Yamagata prefecture, Aomori prefecture, Tottori prefecture 18%
▽ Tokushima Prefectures and Fukui prefectures have decreased significantly, such as 20%.
On the other hand, the amount of decrease was small in prefectures adjacent to Tokyo:
▽ Saitama prefecture was 85%
▽ Kanagawa prefecture was 84%
▽ Chiba prefecture was 76%
▽ Yamanashi prefecture was 60%.
Who are the people in Osaka?
This tendency is also seen in Osaka Prefecture, and it is estimated that the number of people moving in Osaka is estimated to be nearly 400,000, as the number of people in Osaka is increasing by 6%.
Transfers from Osaka prefecture to other prefectures decreased in all,
▽ Miyazaki prefecture was 25% of the same period last year, the most decrease,
▽ Akita prefecture and Shimane prefecture, Kagoshima prefecture was 26%
▽ Nagasaki prefecture Ehime prefecture and Yamagata prefecture have decreased significantly by 27%.
On the other hand, the amount of decrease is small in prefectures adjacent to Osaka, with
▽ Nara prefecture at 83%
▽ Kyoto prefecture at 82%
▽ Hyogo prefecture at 75%.
Who is Aichi?
In addition, the number of people in Aichi prefecture moved by 8%, so it is estimated that the number of people in Aichi prefecture is estimated to be more than 400,000.
Transfers from Aichi prefecture to other prefectures decreased in all,
▽ Akita prefecture decreased the most at 18% of the same period last year
▽ Miyazaki prefecture 21%
▽ Ehime prefecture and Nagasaki prefecture, Iwate prefecture 24% And so on.
On the other hand, in prefectures adjacent to Aichi prefecture,
▽ Gifu prefecture is 65%
▽ Mie prefecture is 56%
▽ Shizuoka prefecture is 51%.
Data by prefecture
For people who have flowed in from other prefectures, we are comparing the average of the three days from August 8 to 10 this year with the average of three days from August 10 to 12 of last year.
▽ Akita 28%
▽ Niigata 33%
▽ Aomori 35%
▽ Yamagata 36%
▽ Kagoshima 36%
▽ Miyazaki 37%
▽ Iwate 37%
▽ Nagasaki 37%
▽ Toyama 40%
▽ Tokushima 41%
▽ Okinawa 41%
▽ Fukui 41%
▽ Ehime 42%
▽ Kochi 42%
▽ Ishikawa 43%
▽ Fukushima 44%
▽ Shimane 44%
▽ Miyagi 45%
▽ Hiroshima 45%
▽ Fukuoka 45%
▽ Kumamoto 45%
▽ Yamaguchi 46%
▽ Nagano 46%
▽ Oita 47%
▽ Hokkaido 47%
▽ Tottori 48%
▽ Kagawa 49%
▽ Aichi 49%
▽ Okayama 50%
▽ Shizuoka 51%
▽ Mie prefecture 52%
▽ Gifu prefecture 55%
▽ Osaka prefecture 57%
▽ Hyogo prefecture 57%
▽ Ibaraki prefecture 59%
▽ Yamanashi prefecture 59%
▽ Saga prefecture 60%
▽ Wakayama prefecture 62%
▽ Tokyo 63%
▽ Tochigi prefecture 63%
▽ Shiga 64%
▽ Gunma 64%
▽ Chiba 66%
▽ Kyoto 67%
▽ Kanagawa 71%
▽ Nara 74%
▽ Saitama 74%