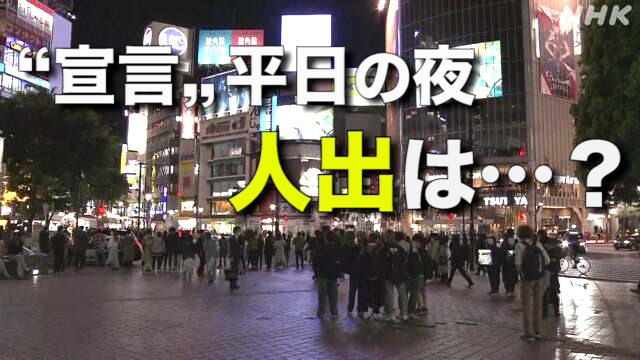
On the night of the 26th, which was the first weekday night after the third state of emergency was declared in four prefectures such as Tokyo, the number of people in downtown areas was analyzed using big data, and it decreased by more than 10% from last week. was doing.
On the other hand, compared to the time of the previous declaration, there was no decrease in Tokyo like in Kansai, and there was a difference between east and west.
NHK used big data collected by NTT DoCoMo from mobile phone base stations in a privacy-protected manner to discuss the downtown areas of the four prefectures where the third state of emergency was declared, at 9 o'clock last night. We analyzed the numbers and compared them with historical data.
[Comparison with last Monday]
Compared to last Monday (19th) night, it decreased at all points.
▽ Shibuya station area
decreased
by 18%,
▽ Shinjuku Kabukicho area
decreased
by 14%,
▽ Kyoto city area near Shijo Kawaramachi
decreased
by 19%,
▽ Osaka city area near Shinsaibashi and Kobe city area decreased by 12%.
[Comparison with previous state of emergency]
The analysis also compared the previous state of emergency, which was issued twice in January last year, with the average of Monday nights, excluding holidays during the past declaration period.
As a result, it increased at all points compared to the first time, but compared to the second time, it decreased in Kansai, but there was no big decrease in Tokyo, and there was a difference between east and west.
[Near Shibuya Station]
The area around Shibuya Station in Tokyo increased by 124%, which is about 2.2 times that of the first declaration, and increased by 2% compared to the second declaration.
[Near Shinjuku Kabukicho]
In the vicinity of Kabukicho, Shinjuku, there was a 50% increase compared to the first time and a 2% decrease compared to the second time.
[Near Osaka Shinsaibashi]
The area around Shinsaibashi in Osaka City increased by 23% from the first time and decreased by 12% from the second time.
[Near Kyoto Shijo Kawaramachi]
The area around Shijo Kawaramachi in Kyoto City increased by 18% from the first time and decreased by 9% from the second time.
[Near Kobe Sannomiya]
The area around Sannomiya in Kobe City increased by 14% from the first time and decreased by 11% from the second time.

