
China News Service, June 7th, according to the website of the General Administration of Customs, according to customs statistics, in May, China's foreign trade import and export was 2.47 trillion yuan, a year-on-year decrease of 4.9%; of which, exports were 1.46 trillion yuan, an increase of 1.4%; imports were 1.01 One trillion yuan, a decrease of 12.7%; the trade surplus was 442.75 billion yuan, an increase of 60.6%.
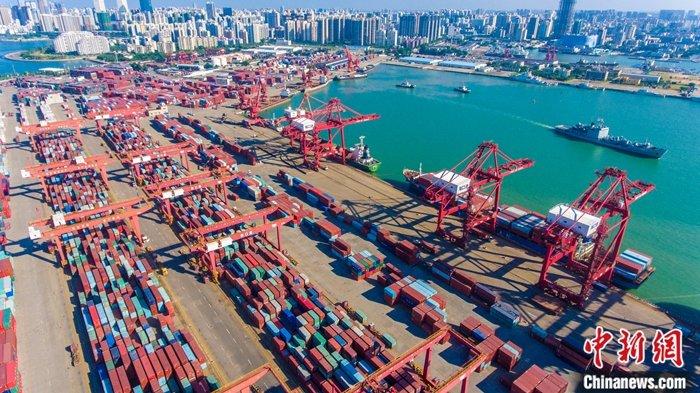
Data Map: Aerial photography of Haikou Xiuying Port Container Terminal. China News Service reporter Luo Yunfei
In the first five months of this year, the total value of my country's imports and exports of goods trade was 11.54 trillion yuan, a decrease of 4.9% compared with the same period last year (the same below), and the decline was the same as the previous four months. Among them, exports were 6.2 trillion yuan, down 4.7%; imports were 5.34 trillion yuan, down 5.2%; trade surplus was 859.81 billion yuan, down 1.2%. In dollar terms, the total value of my country's imports and exports in the first five months was US$1.65 trillion, down 8%. Among them, exports were US$884.99 billion, down 7.7%; imports were US$76.63 billion, down 8.2%; trade surplus was US$121.36 billion, down 4.5%.
In May, my country's foreign trade imports and exports were 2.47 trillion yuan, a year-on-year decrease of 4.9%; of which, exports were 1.46 trillion yuan, an increase of 1.4%; imports were 1.01 trillion yuan, a decrease of 12.7%; trade surplus was 442.75 billion yuan, an increase of 60.6%. In dollar terms, my country’s foreign trade imports and exports in May were US$350.7 billion, down 9.3%; of which, exports were US$206.81 billion, down 3.3%; imports were US$143.89 billion, down 16.7%; trade surplus was US$62.93 billion, up 52.9%.
The proportion of general trade imports and exports increased slightly. In the first five months, my country's general trade imports and exports reached 6.91 trillion yuan, a decrease of 4.7%, accounting for 59.9% of China's total foreign trade value, an increase of 0.1 percentage points over the same period last year. Among them, exports were 3.65 trillion yuan, down 4.3%; imports were 3.26 trillion yuan, down 5.1%. During the same period, imports and exports of processing trade were 2.77 trillion yuan, down 8.1%. Among them, exports were 1.74 trillion yuan, down 9.3%; imports were 1.03 trillion yuan, down 6.1%. In addition, my country's import and export through bonded logistics was 1.39 trillion yuan, down 0.1%. Among them, exports were 464.78 billion yuan, up 3.7%; imports were 928.91 billion yuan, down 1.9%.
Imports and exports to ASEAN increased, while imports and exports to the European Union, the United States and Japan declined. In the first 5 months, ASEAN was my largest trading partner. The total value of trade with ASEAN was 1.7 trillion yuan, an increase of 4.2%, accounting for 14.7% of my total foreign trade value. Among them, China’s exports to ASEAN amounted to 936.62 billion yuan, an increase of 2.8%; its imports from ASEAN amounted to 759.86 billion yuan, an increase of 6%; its trade surplus with ASEAN amounted to 176.76 billion yuan, a decrease of 9%. The EU is my second largest trading partner, and the total value of trade with the EU is 1.61 trillion yuan, a decrease of 4.4%, accounting for 13.9% of my total foreign trade value. Among them, China's exports to the EU were 968.82 billion yuan, down 1%; imports from the EU were 637.32 billion yuan, down 9%; trade surplus with the EU was 331.5 billion yuan, up 19.1%. The United States is my third largest trading partner. The total value of Sino-US trade is 1.29 trillion yuan, down 9.8%, accounting for 11.1% of my total foreign trade value. Among them, my exports to the United States were 964.39 billion yuan, down 11.4%; imports from the United States were 321.84 billion yuan, down 4.5%; the trade surplus with the United States was 642.55 billion yuan, down 14.5%. Japan is my fourth largest trading partner. The total value of Sino-Japanese trade is 846.36 billion yuan, a decrease of 0.3%, accounting for 7.3% of my total foreign trade value. Among them, the export to Japan was 396.1 billion yuan, an increase of 1.6%; the import from Japan was 450.26 billion yuan, a decrease of 1.8%; the trade deficit with Japan was 54.14 billion yuan, a decrease of 21.1%.
The import and export of private enterprises increased and the proportion increased. In the first five months, the import and export of private enterprises reached 5.11 trillion yuan, an increase of 1.8%, accounting for 44.3% of China's total foreign trade value, an increase of 2.9 percentage points over the same period last year. Among them, exports were 3.27 trillion yuan, down 0.1%, accounting for 52.7% of the total export value; imports were 1.84 trillion yuan, an increase of 5.4%, accounting for 34.5% of the total import value. In the same period, the import and export of foreign-invested enterprises was 4.54 trillion yuan, a decrease of 7.3%, accounting for 39.4% of our total foreign trade value. Among them, exports were 2.33 trillion yuan, down 9.4%; imports were 2.21 trillion yuan, down 5%. In addition, the import and export of state-owned enterprises was 1.85 trillion yuan, a decrease of 14.1%, accounting for 16% of China's total foreign trade. Among them, exports were 583.89 billion yuan, down 8.4%; imports were 1.26 trillion yuan, down 16.5%.
Exports of mechanical and electrical products and apparel declined, and textile exports increased. In the first 5 months, my country's exports of mechanical and electrical products reached 3.64 trillion yuan, down 4%, accounting for 58.7% of the total export value. Among them, the export of automatic data processing equipment and its parts and components was 508.61 billion yuan, up 1.8%; the mobile phone was 275.65 billion yuan, down 5.6%. During the same period, textile exports, including masks, were 406.66 billion yuan, an increase of 25.5%; clothing 267.81 billion yuan, a decrease of 20.3%; plastic products 187.26 billion yuan, a 2.1% increase; furniture 122.67 billion yuan, a 14% decrease; shoes and boots 82.11 billion yuan , Down 28.5%; toys 56.74 billion yuan, down 11.8%; luggage 51.05 billion yuan, down 27.6%. In addition, the export of steel products was 25.002 million tons, a decrease of 14%; the number of automobiles (including chassis) was 377,000, a decrease of 16.9%.
Imports of iron ore, crude oil, natural gas, soybeans and other commodities increased, and the average import prices of bulk commodities fell mainly. In the first 5 months, China imported 445 million tons of iron ore, an increase of 5.1%, and the average import price was 629 yuan per ton, up 6.7%; crude oil was 216 million tons, an increase of 5.2%, and the average import price was 2567.4 yuan per ton, down 21.2%; coal is 149 million tons, an increase of 16.8%, the average import price is 503.4 yuan per ton, down 4.7%; natural gas is 40.12 million tons, an increase of 1.9%, the average import price is 2642.1 yuan per ton, down 14.7%; soybeans are 33.883 million Tons, an increase of 6.8%, the average import price was 2770.2 yuan per ton, down 1.7%; primary-shaped plastic was 14.712 million tons, a decrease of 1.3%, the average import price was 9039 yuan per ton, down 10.3%; refined oil was 13.403 million tons, Reduced by 9.3%, the average import price was 3,077.2 yuan per ton, down 18.3%; steel was 5,444,000 tons, an increase of 12%, and the average imported price was 7,043.6 yuan per ton, down 13.9%; unwrought copper and copper materials were 2,185,000 tons, An increase of 12.4%, the average import price was 43,000 yuan per ton, a decrease of 6.3%. In addition, the import of mechanical and electrical products was 2.36 trillion yuan, a decrease of 0.9%; of which 201.15 billion integrated circuits, an increase of 27.3%, valued at 879.43 billion yuan, an increase of 14.5%; 278,000 vehicles (including chassis), a decrease of 36.9%, valued at 92.88 billion Yuan, down 31.3%.