Which prefecture applies? Analysis of infection status by government subcommittee index 19:02, August 7
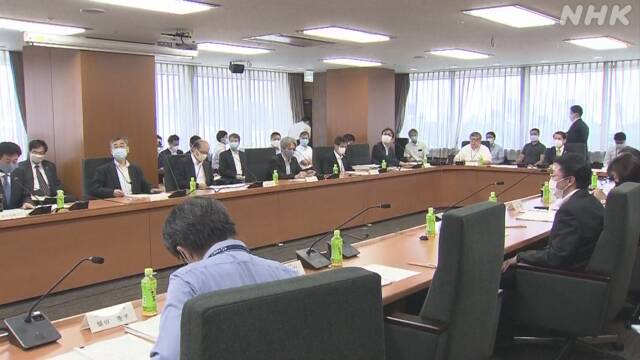
The subcommittee of the government, which is considering measures against the new coronavirus, has so far presented the idea of dividing the infection situation into four stages, from the stage where the infection occurs sporadically to the stage where it spreads explosively. Then, on the 7th, at the meeting held, we showed the index to judge which stage we are in along with concrete numerical values.
Let's take a look at which prefectures currently apply to each indicator.
Positive rate of PCR test
First, the positive rate of PCR test.
Two prefectures, Aichi prefecture and Osaka prefecture, exceeded the “positive rate of 10%”, which was the index for stage 2 and stage 4 on average for the week from 27th to 2nd of last month.
▽ Aichi prefecture 18.5%
▽ Osaka prefecture 11.1%
Number of new infections
Next is the number of new infections.
In the week leading up to the 5th, the number of infected people per week of 100,000, which was set as the index of Stage 3, was 15 or more in two prefectures, Tokyo and Fukuoka.
▽ Tokyo 17.41 people
▽ Fukuoka prefecture 16.58 people In the
same period, the number of "weekly infected people per 100,000 population", which was the index of stage 4, was more than 25 people in Okinawa prefecture, which was 30.21 people. I am.
Comparison of the number of infected people in the last week and the previous week
Next is a comparison of the number of infected people in the last week and the previous week.
Regarding the number of infected people per week until the 5th, the following 35 prefectures are the indicators of Stage 3 and Stage 4 that "the number of infected people during the last week is higher than the previous week".
▽Hokkaido (2.68)
▽Miyagi prefecture (1.60)
▽Fukushima prefecture (2.00)
▽Ibaraki prefecture (2.21)
▽Gunma prefecture (2.11)
▽Saitama prefecture (1.38)
▽Chiba prefecture (1.74)
▽Tokyo city (1.34)
▽Kanagawa prefecture (1.92)
▽ Niigata (3.00)
▽ Toyama (14.50)
▽ Fukui (1.56)
▽ Yamanashi (2.40)
▽ Nagano (1.44)
▽ Gifu (1.11)
▽ Aichi (1.62)
▽ Mie (2.87 ) )
▽ Shiga (2.09)
▽ Kyoto (1.05)
▽ Osaka (1.28)
▽ Hyogo (1.43)
▽ Nara (1.30)
▽ Tottori (1.80)
▽ Okayama (1.11)
▽ Hiroshima (1.11)
▽ Tokushima Prefecture (3.13)
▽ Kagawa Prefecture (7.00)
▽ Ehime Prefecture (1.83)
▽ Fukuoka Prefecture (1.83)
▽ Saga Prefecture (2.88)
▽ Nagasaki Prefecture (7.18)
▽Kumamoto prefecture (1.54)
▽Oita prefecture (6.00)
▽Miyazaki prefecture (1.31)
▽Okinawa prefecture (3.72)
Percentage of people whose infection route is unknown
Percentage of people whose infection route is unknown.
The following 16 prefectures had an average of "50%" or higher, which was the index for stage 3 and stage 4 during the week ending on the 31st of last month.
▽Hokkaido (55%)
▽Aomori prefecture (100%)
▽Iwate prefecture (75%)
▽Miyagi prefecture (50%)
▽Akita prefecture (50%)
▽Fukushima prefecture (100%)
▽Gunma prefecture (57%)
▽Tokyo Tokyo (59%)
▽ Kanagawa (65%)
▽ Toyama (80%)
▽ Aichi (57%)
▽ Osaka (67%)
▽ Shimane (100%)
▽ Kagawa (100%)
▽ Fukuoka (60%)
▽ Nagasaki (52%)

